“I’m the #4 water brand in the US, so I should be #4 on Amazon.” —Large national bottled water brand
“Our strategic goal for Amazon this year is to gain our fair share.” —Large beauty brand
“We had a strong quarter, experiencing XX ppts of share growth on Amazon.” —Large cereal and snacks manufacturer
If I had a dollar for every time I heard a client—mostly CPGs—talk about their “fair share” on Amazon, I’d be a very rich woman, sitting on a beach watching my three kids play in the sand, and not writing articles about Amazon and eCommerce. Today, we’ll explore why market share on Amazon is an almost meaningless metric and discuss what you should use instead.
1. “Share” is an output metric, and you should focus on the inputs to your Amazon business
On Amazon, there are input metrics and output metrics. You can’t control the outputs, or rather you can’t control the external factors that affect them. However, you can completely control your inputs.
I have worked with many manufacturers that remained doggedly focused on gaining share while they failed to fill their purchase orders, lacked any sort of control over their distribution (leading to pricing wars and CRaP out), had loads of missing images, no bullet point content, ineffective Amazon Advertising campaigns, or had huge gaps in their Amazon assortment. No amount of focus on market share is going to fix broken inputs. Get your products in stock and give customers content that helps them make purchase decisions, then we’ll talk about share.
Proper and accurate item set up, financial viability, and driving traffic and activity to your items are the inputs to success on Amazon.
2. “Share” assumes that customers shop by category, like in brick and mortar. And they don’t.
This is the most fundamental reason why share is a flawed metric on Amazon—it is not customer-centric. At my local QFC, for example, I shop by aisle. My choices are limited to what’s presented to me, save the endcap. I choose from the options available with relatively limited distractions, and most of what’s available are nationally recognized brands.
On Amazon, the category, as far as the customer is concerned, is the search results for their given search.
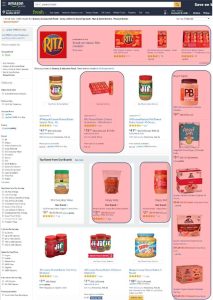
The consumer behavior on Amazon is quite different. For example, see Exhibit A, the search results for the term “peanut butter.” There are 47 products presented to the customer on the first page. 13 of them are not peanut butter at all—crackers, trail mix, and snacks. Eight are brands I’ve never heard of, and I’m fairly certain don’t have national distribution. Three are powdered peanut butter (not traditionally part of the peanut butter category.)
Don’t think these are your product peers? Don’t think this is apples to apples, that customers consider these products alongside one another? You’re wrong! Amazon’s ad platform won’t let ads that don’t get clicks win the slots. So, people are certainly searching peanut butter and buying Ritz, in this example. Also, Amazon’s natural (non-paid) search relevance algorithm is smart, too. It also shows the products customers often buy after typing in peanut butter.
However, that’s just the first page of search results. Which brings me to the 3rd reason share is a flawed metric on Amazon.
3. “Share” assumes a fixed category size.
My search for peanut butter contains over 1,000 results. Selection is infinite on Amazon, and therefore the potential category size is infinite, too.
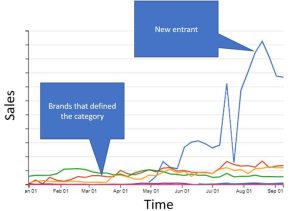
Continuing with the peanut butter example, see Exhibit B. Let’s say this was the size of the peanut butter category, a few major national players and some small scrappy brands. Then a new development in May—powdered peanut butter! Whoa, revolutionary! Everyone’s buying it, even bodybuilder dudes who gave up PB&J when they graduated 8th grade. Now the entire category dynamics have shifted almost overnight, and your share plummets. However, you’ve changed nothing.
Jeff Bezos used to say, “We’re not any smarter when the stock price is higher, because we’d have to be dumber when the stock price is lower.” Same goes for share. Category dynamics change rapidly—and dramatically—on Amazon, and you’re not any smarter or dumber when the category share fluctuates. Which leads me to #4…
4. “Share” data quality is suspect at best.
How do you define your category? How does your share provider define the category and calculate its size? How does Amazon? Having seen many versions of share data, including Amazon’s share data—currently provided only to top CPGs—I can attest that rarely do the categorizations and data match. If the provider is using Amazon’s categorization, the data is dirty. Vendors provide their own product categorization, choosing from an arbitrary list of categories. Amazon doesn’t really care if the categorization is wrong, because it’s not used. Again, the category is defined by the search term, not the category breadcrumb trail associated with the product.
Well, what should I use, then?
Okay, okay, I get it. You must use share data. It’s part of your company’s DNA, and I’m wasting my breath. I’m not telling you not to use it, or that the providers do a bad job calculating it. It has its place in your KPI toolkit. Start weaning your company off of it in favor of input metrics. What are these other metrics? Retail readiness! Completely unsexy metrics like in-stock rate, purchase order fill rates, replenishable out-of-stock, title, bullet, and feature utilization percentages, and Amazon Advertising (and other external media) impressions are the key inputs to your Amazon business and are completely worth focusing on. Best-in-class manufacturers have a clear handle on these metrics and hold their teams accountable for them before they even start talking about share.
To understand how you’re performing against your peers, start by determining the search terms you must and can affordably win. Those are the categories, period. Then look at your peers in search results, including ads. Metrics that help you understand your products’ share of search results (SOSR) and share of clicks and conversion for those terms vs. competitors are the ones you want to monitor. Lastly, get your hands on category growth rates for your category and peers. While still an output metric, growth relative to competition is a fundamental part of understanding your opportunity and building your plan.
How has share helped you make decisions? What other metrics do you use to understand your competitive health?


